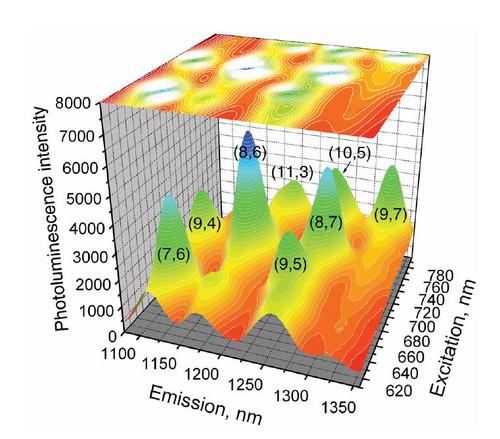
Nanosizer® in Origin® Pro 8 simplifies the process for simulation and analysis for single‐walled carbon nanotube excitation‐emission map simulation and analysis. Nanosizer is used with our Nanolog spectrofluorometers, which are specifically designed for research in nanotechnology and nanomaterials. Nanosizer comes with our patented double-convolution-integral algorithm specially designed for determining chirality and diameter of single-walled carbon nanotubes.
Nanosizer® lets you simulate excitation-emission maps of SWNT near-IR fluorescence to compare to your actual data. Using built-in or custom libraries, Nanosizer® rapidly assigns specific peaks to particular SWNT (n,m) structures, and even generates helical maps. Nanosizer® also greatly simplifies FRET studies of SWNT bundles, length-distribution analyses, and nanotube purification analyses. Nanosizer® even offers a platform suitable to support future ISO and ASTM standards for identification and purification of semiconducting SWNTs.
Perfect for FRET in SWNT Bundles, Length Distribution Analysis, and Purification applications
Features and Benefits of Nanosizer® in OriginPro® 8
- Efficient Region of Interest and Initial Model Parameterization
- Virtually unlimited number of peaks
- Global linking and fixing of peak parameters
- Full constraints on all model peak parameters
- Save Themes for rapid model parameterization
- 2D analytical line shapes: Gaussian, Lorentzian and Voigt Convolution
- Correct statistical weighting of residuals
- Fully featured statistical analysis of fit peak parameters
- Graphical and tabular presentation of fit results and residuals
- Fits data in energy (cm–1, eV) or wavelength (nm) units
- Compares peak parameters to user editable library for helix angle, diameter and (n,m) distribution plots and tables
- Designed for ISO and ASTM Standards for Semiconducting SWNT Identification/Quantification


